PSF_LOGO

Plastic Facts and Figures

How big is the plastic pollution? How much plastic is in the sea? And how much is actually recycled? These are all questions that are not easy to answer. We have only been aware of the ‘plastics soup’ phenomenon for about 25 years.

Slowly but surely, the answers are trickling in from the hundreds of scientists around the world who are trying to get a handle on both the extent and the consequences of the problem. To provide you with the following plastic facts and figures, we have made a selection from the scientific research we consider reliable. The sources used are listed.

undefined_NL-JPG01

More and more plastic

The amount of plastic produced worldwide each year has exploded within the span of one human lifetime: from 2 million tonnes in 1950 to over 390 million tonnes in 2021.¹
 
These are the figures from the plastics industry itself, but this does not include all synthetic fibres, so actual production is much higher still.
 
More than half of all the total plastic produced was not marketed until after the year 2000. And production is expected to quadruple by the year 2050 (compared to 2019), reaching 1480 million tonnes.² So that would be almost three times the total weight of the current world population!
NL-JPG02-1500x1057

What do we use all that plastic for?

By far the most plastic, 44%, is used for packaging material. This is therefore where the most environmental gains can be made if we want to reduce our plastic use. In second and third place are the construction and automotive industries, respectively¹.
PSF210611_infographics_NL3-2048x1442

What happens to all that plastic after purchase?

Between the 1950s and 2017, an estimated 9.2 billion tons of plastic have been manufactured. Of this, a little more than one quarter is still in use and only 600 million tons has been recycled¹. About 40% of all plastic products are thrown away within one month². Year after year we saddle the earth with about 300 million tons of plastic waste.³
PSF210611_infographics_NL-2

Which countries are the biggest plastic polluters?

The average European throws away 172.2 kilos of packaging waste away every year, of which 19.5% is plastic. So on average, every person in Europe adds 34.5 kilos of plastic packaging to the mountain of plastic waste every year.¹
These figures are often a lot higher in other regions of the world. According to research the United States of America are the biggest producers of plastic waste.²
NL-JPG05-1030x726

Which brands are the biggest plastic polluters?

On World Cleanup Day we always ask the people who clean up to note the litter they find and record the type of waste and the brand. So in the Netherlands, we know that Red Bull has been at number 1 for years. International research in 2020 shows that Coca-Cola products were the products that ended up in the environment the most.¹ Worldwide, Coca-Cola produces 167,000 plastic bottles every minute. If you would put them in a line, they would go to the moon and back 31 times.²
PSF221206_infographics_ENG06-1500x1057

How much plastic ends up in the plastic soup?

 More than half the 9.2 billion tons of plastic that has been produced up to now – about 5 billion tons – has ended up as waste in landfill or has simply ended up in the environment.¹ Of this, between 5 and 13 million tons of plastic enter the oceans.²
In 2017, two groups of scientists, independently of each other, discovered that 90% of all the plastic in the ocean was brought there by 10 major rivers which included the Nile, the Yangtze and the Amazon.³ In 2021, that statistic was overturned by new research.4 This research showed that 80% of the plastic in the ocean was not emitted by just a small group of rivers, but by more than 1,000 rivers. And that most of the waste was not carried by the biggest rivers, but by the small rivers that flow through heavily populated areas. It appeared that it was not the Yangtze but the Pasig, that flows through Manila, the capital city of the Philippines, that brings the most plastic to sea.
Apart from all the plastic waste that comes from land, the fisheries are also a huge source of plastic pollution.
Plasticsoep-2048x1443

What are the ‘ingredients’ of the plastic soup?

Plastic never degrades, instead it fragments into ever smaller pieces until it cannot be seen with the naked eye. The map below shows the composition of the plastic soup in the various oceans and you can see the type of plastic floating around in them.¹
Not all microplastics are caused by fragmentation, but may arise from the wearing out of car tyres, wearing and washing synthetic clothing, rinsing off toiletries and cosmetics, and the ‘spilling’ of nurdles, small plastic granules, by the plastics industry.
Only 0.5% of the plastic in the ocean actually floats on the surface of the water. The rest drifts deeper in the water column or lies on the seabed.² So cleaning up the water surface only solves a tiny bit of the problem.
PSF210611_infographics_NL8-1

Microplastics on land

These days everyone has heard the term ‘plastic soup’, but the reality is that the fields where our crops grow are 4 to 23 times more heavily polluted with microplastics than the oceans.¹
The microplastics that are intentionally added to our toiletries and cosmetics flow from our bathrooms into sewers. The sewer sludge, with plastic and all, is later spread on the land as fertiliser. Recent research shows that microplastics are then absorbed by vegetables and fruit such as carrots and apples through their root systems, and thus end up on our plates.²
PSF210910_infographics_NL9-2-2048x1442

Is it jeopardising our health?

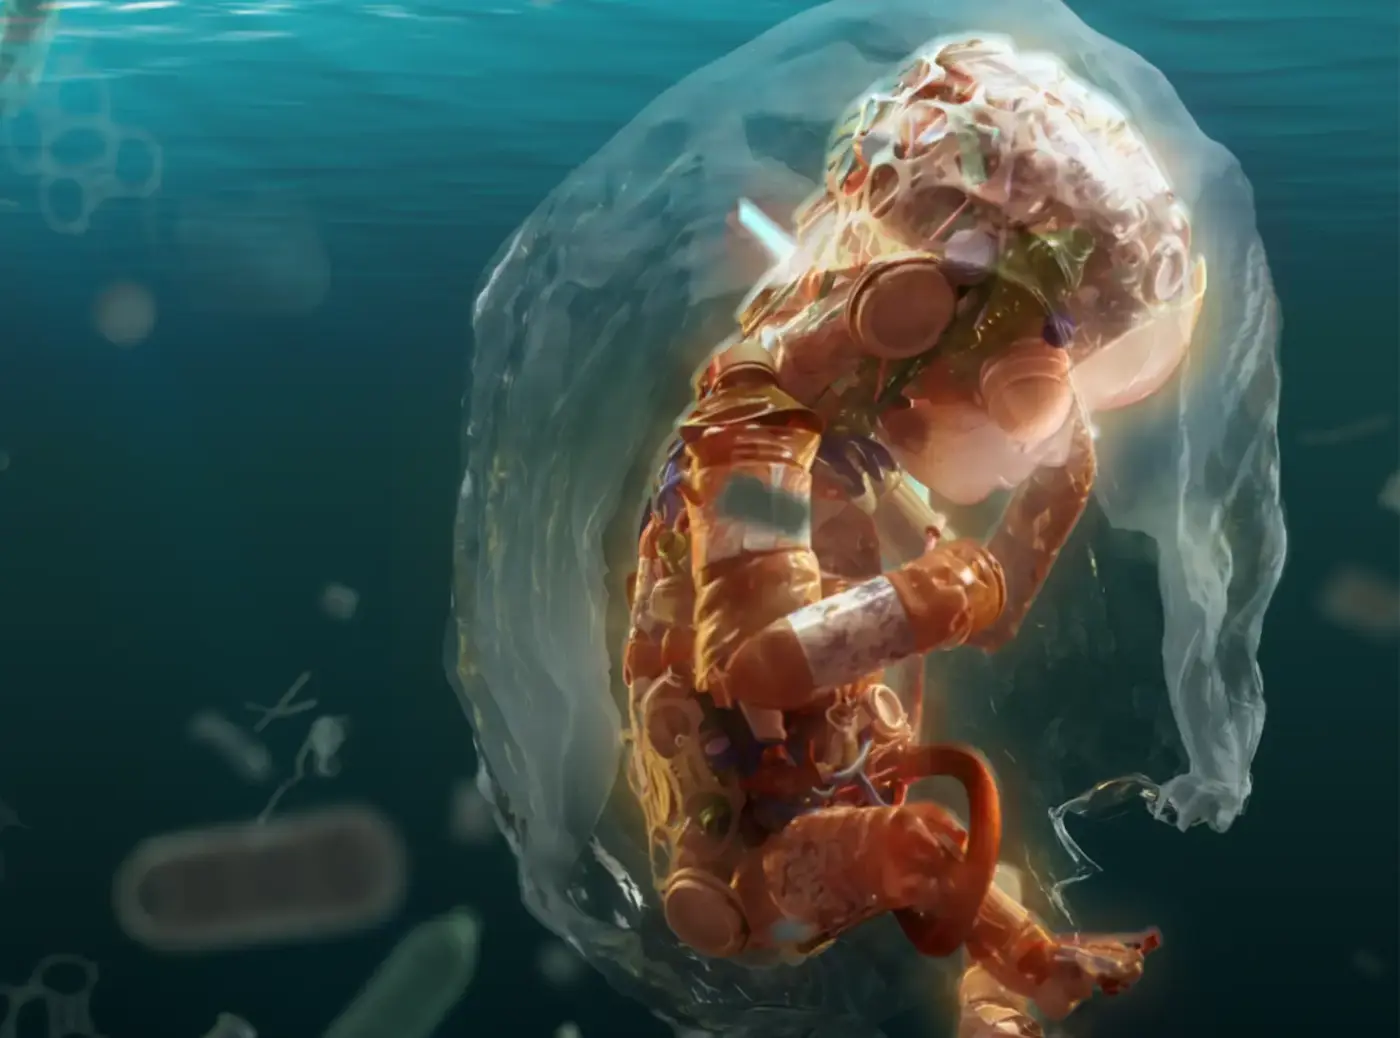
Research into the effects of microplastics and the even smaller nanoplastics are still in its infancy, but more and more scientists are starting to worry about their effects on human health. We all ingest micro- and nanoplastics through the food chain, drinking water, via the skin and inhaling.
Another risk factor is that plastic contains hazardous hormone disruptors³ and also absorbs toxins that are in the environment. Research among pregnant women in the United States of America showed that they have an average of 56 different chemical substances in their blood.¹ The assumption that these could lead to the following health risks are becoming increasingly well founded.²Apart from this, the incineration of plastic waste in the open air also poses great risks to our health.
In 2022 Plastic Soup Foundation published an overview¹ of all the effects of plastic microfibres on various organs and the immune system scientifically established to date. In 2021 and 2022 alone, over 400 scientific articles were published on the health effects of microplastics.
PSF210611_infographics_ENG10-2048x1442

To what extent is plastic a contributing factor to climate change?

Science is also looking more at the role that the production, incineration and recycling of plastic and plastic pollution play in climate change. After all, plastic is made of fossil fuels. There is a great demand for research into the effects that the microplastics contained in the ice caps and in the air may have on the speed at which the earth is warming.
If we want to limit the warming of the earth to one and a half degrees by 2050, we should not emit more than 570 billion tons of CO2. Of this, 10% to 13% will be emitted by the production of plastic and the incineration of plastic waste.¹

Subscribe to the newsletter

© 2024 Plastic Soup Foundation